The State of America’s Roads: a Look at the growth and decay of roads in America
From the bumpy, pothole-pitted roads to the broken bridges, parts of America’s infrastructure are in a state of disrepair. These deteriorated structures come at a heavy cost to Americans in terms of money, time, stress – and for some, even their lives.
Fueled by our passion for transportation and road quality, we at Busbud.com decided to investigate the situation. Using data from the U.S. Department of Transportation, we took a hard look at roadway and bridge conditions, the growth of America’s roads, and the costs associated with driving. Below, we’ll steer you through the surprising details.
Road Condition Across the Country
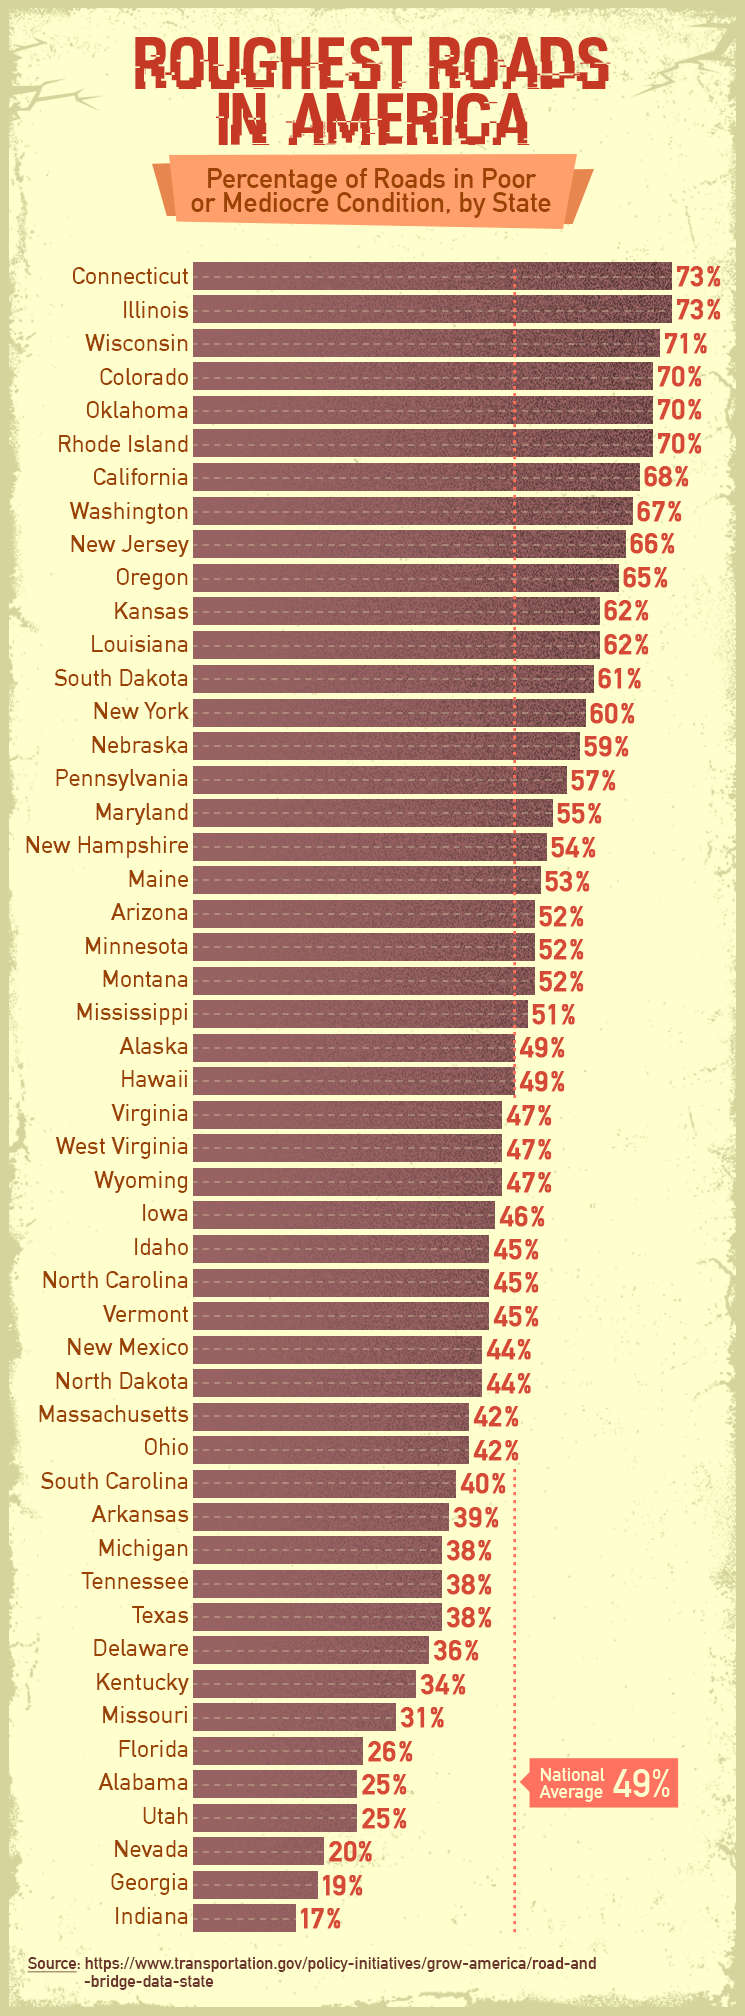
Across the United States, millions of miles of decaying roads cause more than a shaky drive. They snarl traffic, cause delays, cost motorists millions of dollars, and increase the risks of driving. Roads pitted with potholes or lacking certain features such as shoulders and rumble strips can fuel collisions, putting drivers and passengers at increased risk of injury and even death.
Road conditions vary from state to state. Illinois and Connecticut tie for the worst roads in the nation. In each state, a whopping 73 percent of the roads are in poor or mediocre condition. According to one official, some of the road problems in Connecticut can be chalked up to frequent traffic passing through the small state. In Illinois, it might be tempting to blame the crumbly roads on extreme weather conditions in the North – however, neighboring Indiana actually has the lowest percentage of roads in poor or mediocre condition. Other states with high rates of roads in disrepair include Wisconsin, Colorado, Oklahoma, and Rhode Island.
As mentioned, Indiana is in the best shape among all states – only 17 percent of its roadways are in poor or mediocre condition. Georgia, Nevada, Utah, Alabama, and Florida also rank on the low end for roads in disrepair.
Bridge Condition in the United States
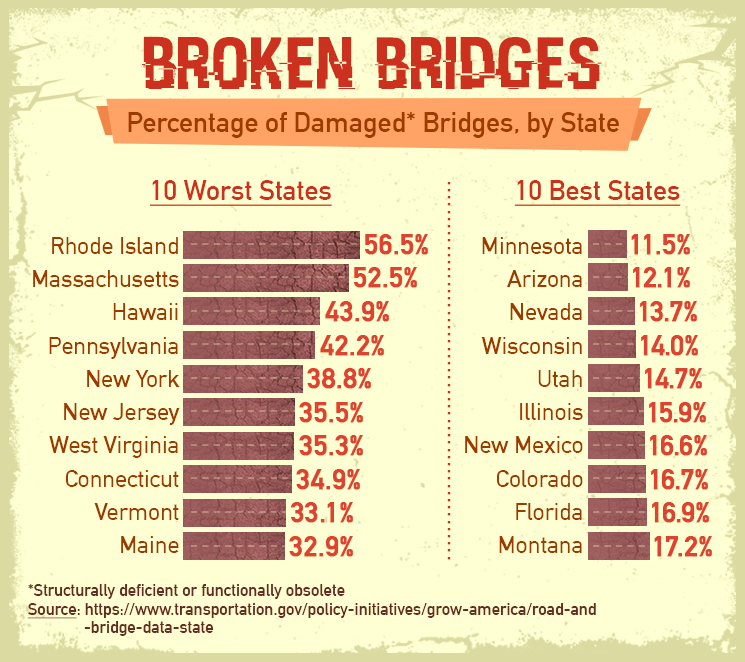
A staggering number of bridges in the United States are structurally deficient or functionally obsolete, which causes a risk to everyone on the road. What do these terms mean? A structurally deficient bridge has one or more deteriorating component – such as cracks or wear – but it is not necessarily unsafe. However, a functionally obsolete bridge was constructed using outdated standards, meaning today’s use exceeds the one-time intended load – and it is by far the more dangerous type.
Proportionally speaking, Rhode Island is in the worst shape: 433 of the state’s 766 bridges (56.5 percent) are deficient or obsolete. In Massachusetts, 2,694 of the 5,136 are failing; in Hawaii, 494 of the 1,125 bridges are deemed unsafe. Minnesota has the lowest percentage of structurally deficient or obsolete bridges: 1,513 of the 13,137 (or 11.5 percent). In Arizona, 954 of the 7,862 bridges are unsound, and in Nevada, 253 of the 1,853 are not safe.
Photos and videos on the news and social media chronicle the horrific scene that ensues when a bridge fails. Occupied vehicles plunge into icy water, cars become life rafts, and people fear for their lives. In 2007, the collapse of the structurally deficient I-35W bridge in Minneapolis killed 13 people and injured 145. Infuriatingly, the bridge had been designated structurally deficient for 17 years and was slated for repair in 2020 – many years too late to save lives.
And in 2013, a section of the Skagit River Bridge in northern Washington State collapsed after a truck carrying an oversized load struck the trusses. Injuries were minor, but the aftermath – detours, traffic congestion, and delays – frustrated residents and hurt local business.
The recently inspected bridge was not structurally deficient – it was functionally obsolete. It was not designed to handle either the current traffic volume or the size, weight, and height of today’s trucks. Shockingly, a lack of funding meant the state had to repair rather than replace the structurally deficient bridge – resulting in an updated bridge that remains structurally deficient.
The Price of America’s Crumbling Infrastructure
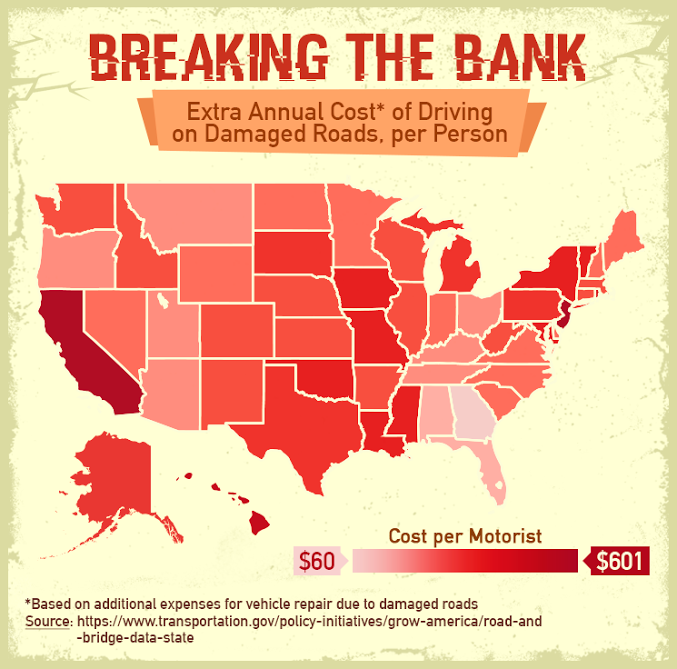
Even if rough roads weren’t an issue, factors like fuel and insurance mean car ownership can be expensive. But adding rough pavement and potholes into the equation send costs skyrocketing due to higher operating costs and necessary vehicle repairs, such as suspension, steering, and paint jobs.
Each motorist in the country spends an average of $300 due to poor and mediocre road conditions. However, this cost varies greatly by state. Crumbling roads take the heaviest toll in New Jersey, where drivers spend an average of $601 per year. In California, motorists average $586 apiece, and in Hawaii they spend $515.
On the other hand, motorists in Georgia get the best deal, with an average expenditure of $60 apiece. Drivers in Florida spend $128 on average, while motorists in Oregon fork out $173.
In addition to these costs, deteriorated roads can cause traffic flow issues, which lead to higher fuel consumption. As if it’s not enough to pay for gas or fund repairs caused by potholes, consider this. Taxpayer dollars fund road repair, so in effect, you’re paying even more than you might think as a result of crumbling roads.
Road Length Across the Country
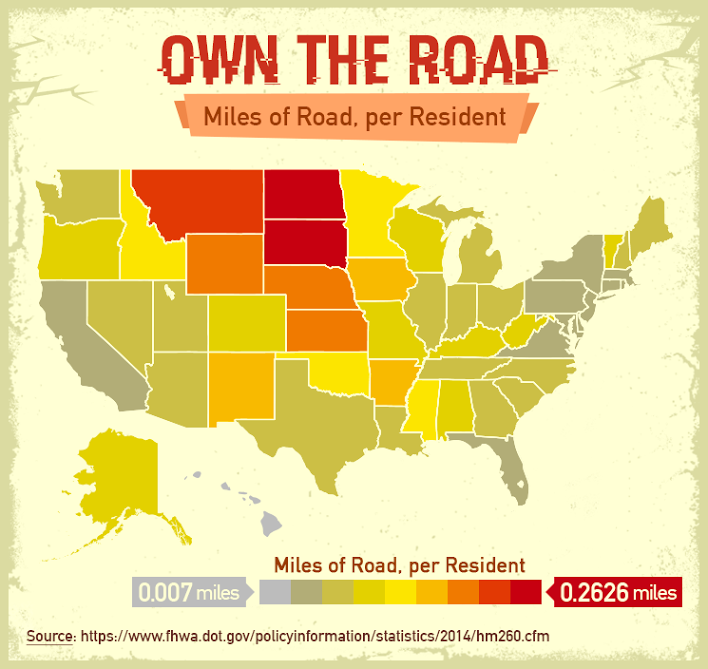
Now that we’ve examined road conditions and motorist expenditures, we wanted to consider how many miles of road each state is actually responsible for maintaining. We compared road length with population to get a snapshot of the length of road the average resident “owns” in every state.
Overall, the Midwest and a few Southern states have the most roadway per capita. North Dakota tops the list with a little over a quarter of a mile for every resident. Next comes South Dakota with just over one-fifth of a mile per person and Montana with 0.15 miles per person. Conversely, a Hawaii resident has just 0.007 miles of road, and a person in New Jersey 0.01 miles.
The costs associated with failing to maintain these stretches of roadway vary greatly. A New Hampshire Department of Transportation official told NPR that it costs $50,000 to repave a mile of decently maintained road – but $1 million to reconstruct a mile of deteriorated road.
States That Guzzle Gasoline
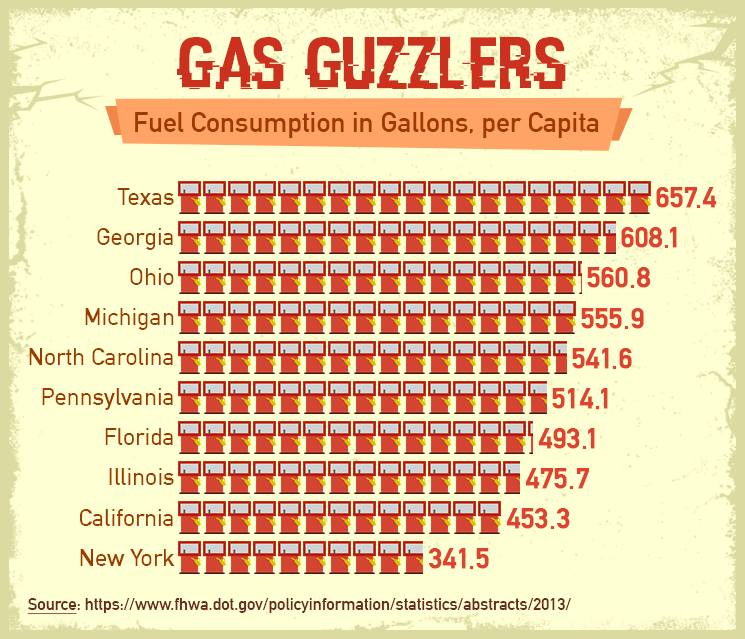
The United States is a country filled with drivers. In 2015, we consumed 140.43 billion gallons of gasoline, for a daily average of around 384.74 million gallons. But some states consume more than others. Texas outpaces the rest of the United States for fuel usage, with an annual consumption of 657.4 gallons for every resident. Georgia, Ohio, and Michigan also rank on the high end for fuel usage. Motorists in these large rural states tend to require more fuel than drivers in small urban states.
Although Americans log more miles on the road than ever, increased fuel efficiency has actually led to decreased gas consumption. How do gas costs break down for Americans? Fuel costs fluctuate, but assuming a cost of $2.50 per gallon, the 140.43 billion gallons of gas the country consumed in a year costs around $351 billion – enough to fund Hillary Clinton’s proposal to make college affordable and relieve student debt burden, purchase 3,050 Boeing airplanes, and cover the worldwide costs of the 2016 Zika epidemic 100 times over.
Tracking U.S. Road Expansion
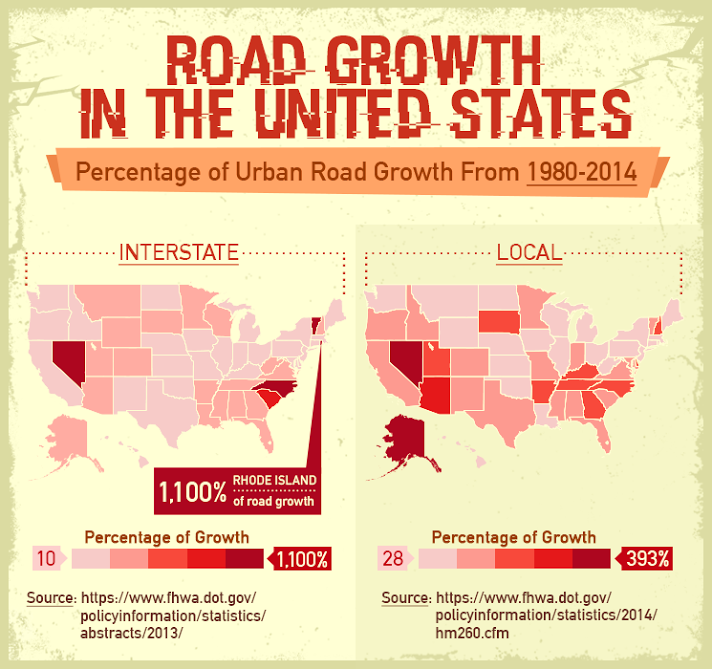
The U.S. has the largest network of roads compared with any country. And in the past three decades, the length of both interstates and local roads has increased. When it comes to interstates, Rhode Island by far outpaces the rest of the country with a whopping 1,100 percent growth. Vermont, Nevada, and North Carolina have also experienced among the highest percentages of interstate expansion. However, as for local roads, Alaska, Nevada, and Arizona have had the most growth.
Navigating America’s Crumbling Infrastructure
As our analysis reveals, many of the roadways and bridges in the United States are in dire need of repair, with problems ranging from poor pavement conditions to an inability to meet today’s demands. The issues cause traffic congestion, delays, vehicle damage, wasted gasoline, and even crashes.
Meanwhile, every day, cars, buses, trucks, and emergency vehicles traverse these deteriorating – and even dangerous – paths. And according to the U.S. DOT Federal Highway Administration, America’s driving will only increase. It projects mileage for all vehicles will increase an average of 0.61 percent every year through 2043.
According to the U.S. DOT, the reason behind deteriorating roads lies in the funding strategy – and opting for short-term fixes rather than the long-term funding of transportation. While we wait to see what happens, one thing is certain: Drivers need to be more alert than ever as they navigate the country’s crumbling roads and bridges.
Need a break from the stress of driving? At Busbud.com, we make it possible for you to relax and let someone else take the wheel. By riding the bus, you can do your part in helping relieve pressure off overused roads* while also lowering your fuel consumption and reducing greenhouse gases.
*A full bus can take more than 40 cars off the road.
Methodology
Data were extracted from four sources. Data from the following sites were taken and combined using the 1980 miles and 2014 miles for each state in Interstate, Local, and Total, and then using a percent difference calculator to find the growth from 1980 to 2014.
https://www.fhwa.dot.gov/policyinformation/statistics/2014/hm260.cfm
https://www.fhwa.dot.gov/policyinformation/statistics/2014/
The remaining data were taken from the sources below and visualized for the purpose of this article.
Infographic Sources
http://www.fhwa.dot.gov/policyinformation/statistics/2014/hm260.cfm
https://www.fhwa.dot.gov/policyinformation/statistics/2014/
https://www.fhwa.dot.gov/policyinformation/statistics/abstracts/2013/
https://www.transportation.gov/policy-initiatives/grow-america/road-and-bridge-data-state
Textual Sources
https://stateimpact.npr.org/new-hampshire/2013/03/13/what-bad-roads-mean-for-your-car-pocketbook-safety-and-more/
http://www.ctpost.com/local/article/Connecticut-s-roads-among-worst-in-nation-5623870.php
http://www.governing.com/gov-data/transportation-infrastructure/bridge-data-by-state-inspections-structurally-deficient-totals.html
http://www.popularmechanics.com/technology/infrastructure/a8976/just-how-fragile-are-americas-bridges-15526104/
http://www.popularmechanics.com/technology/infrastructure/a7931/the-minnesota-bridge-collapse-5-years-later-11254114/?click=main_sr
http://www.heraldnet.com/article/20130617/NEWS01/704019954
http://www.landlinemag.com/Story.aspx?StoryID=29393#.V1kMrm0rLnA
https://stateimpact.npr.org/new-hampshire/2013/03/11/the-roads-series-part-i/
https://www.eia.gov/tools/faqs/faq.cfm?id=23&t=10
http://apps1.eere.energy.gov/states/transportation.cfm/state=OR
http://www.washingtonpost.com/wp-dyn/content/article/2007/08/02/AR2007080200423.html
http://www.reuters.com/article/us-usa-driving-idUSKCN0YI29Z
http://www.eia.gov/dnav/pet/hist/LeafHandler.ashx?n=PET&s=EMM_EPM0_PTE_NUS_DPG&f=W
https://www.washingtonpost.com/news/wonk/wp/2015/08/10/clinton-proposes-a-350-billion-plan-to-make-college-affordable/
http://www.prnewswire.com/news-releases/boeing-forecasts-350-billion-market-for-new-airplanes-in-latin-america-300179341.html
http://www.scientificamerican.com/article/how-do-we-know-the-zika-virus-will-cost-the-world-3-5-billion/
http://www.statista.com/statistics/262887/length-of-the-largest-road-networks/
http://www.fhwa.dot.gov/policyinformation/tables/vmt/vmt_forecast_sum.cfm
https://www.transportation.gov/sites/dot.gov/files/docs/GROW_AMERICA_2015_Overall_Fact_Sheet_FINAL_July_2015.pdf
Fair Use
You are encouraged to use the graphics and information from this project. If you do, please acknowledge our authors and link back to this page as well as www.busbud.com.